Europe's extraordinarily hot summer of 2026: why the same weather pattern kept returning
Western Europe's warmest summer on record was the same atmospheric pattern coming back, from May into September.
Europe's summer of 2026 felt like one long heatwave. It wasn't. The same atmospheric pattern came back multiple times, which is why it felt like it would never end.
Western Europe experienced its warmest summer on record in 2026. Between June and August, the region's average temperature reached 21.69°C, or 2.54°C above the 1991–2020 average. That was 0.56°C warmer than the previous record set in 2003. Across Europe as a whole, the summer ranked third-warmest, at 1.17°C above average, behind 2024 (+1.55°C) and 2022 (+1.34°C).
The difference between the regional and continental figures is important as it reflects how unevenly the heat was distributed across Europe. Western Europe experienced particularly exceptional temperatures, while the rest of the continent was less extreme, which brought the European average down.
The comparison with 2003 is also interesting. At the time, that summer stood out sharply from the surrounding years, making it a clear outlier for its decade. By 2026, the picture looked rather different. Every summer in western Europe since 2015 had been warmer than the 1991–2020 average, and 2022 had already come close, within 0.08°C, to the 2003 record. What was once an extraordinary outlier was now being approached, and eventually surpassed in 2026, against a much warmer background.
Western European summer temperature anomalies


June–August mean 2 m temperature over western European land, 11°W–15°E and 37°–55°N, as an anomaly from 1991–2020. The dashed line is 2003. 6-hourly ERA5. This series puts 2003 at +1.96°C, 2022 at +1.91°C and 2026 at +2.55°C, within 0.02°C of the Copernicus summer review.
The figures in this section are from the Copernicus summer review.
But seasonal averages hide something important about how the heat developed. The summer was not one continuous heatwave. Instead, western Europe experienced a succession of distinct hot spells, beginning unusually early in May and recurring throughout the summer.
To understand just how unusual these events were, it helps to distinguish between heatwave severity and intensity. Intensity describes how far temperatures rose above normal during an event. Severity also accounts for how long the heatwave lasted and how much of the region it affected. A shorter, exceptionally hot event can therefore be more intense than a longer one without necessarily ranking as more severe overall.
Heatwaves in summer 2026


The four heatwaves were separate spells between late May and mid-August. June lasted 11 days and ranks second in severity since 1950. Dates and ranks from the Copernicus summer review. No severity score is plotted.
That distinction matters when comparing 2026 with August 2003. Although the 12-day August 2003 heatwave remains the most severe in the historical ranking, the June 2026 event ranks second, and all four of the summer's major heatwaves were more intense than the 2003 event.
The heatwaves were exceptional not only because of their intensity and duration, but also because of how much of western Europe they affected. On 24 June, 29 July and 14 August, approximately 75% of the region experienced temperatures of at least 30°C, while more than 30% exceeded 35°C.
|
At least 30°C |
At least 35°C |
| 24 June, 29 July and 14 August |
about 75% |
more than 30% |
| May and September 2026 |
more than 40% |
|
| May and September 2003 |
under 13% |
|
The extent of the heat was unusual even outside the main summer months. In May and September 2026, more than 40% of western Europe experienced temperatures above 30°C on individual days. For comparison, the equivalent geographical coverage in May and September 2003 remained below 13%.
France provides a particularly striking example of how widespread the heat became. During the June heatwave, approximately 40% of the country experienced temperatures exceeding 40°C. Across the summer as a whole, 90% of France recorded at least one day above 35°C, while 45% experienced temperatures above 40°C.
These figures describe air temperature, but air temperature alone does not tell us how difficult the conditions were for people to tolerate. For that, we need to consider heat stress.
Heat stress depends on more than the temperature shown on a thermometer. Humidity affects how efficiently the body can cool itself through sweating, while wind and solar radiation also influence how hot conditions feel. One way of quantifying this is the Universal Thermal Climate Index (UTCI), which combines these meteorological factors to estimate the thermal environment experienced by the human body.
By the end of summer 2026, 52% of European land had experienced at least one occurrence of very strong heat stress, corresponding to a UTCI of at least 38°C. The previous largest geographical extent was 46%, recorded in 2010.
The character of the heat also changed between events. In late June, humid conditions in parts of the UK and Ireland contributed to apparent temperatures around 5°C higher than the measured air temperature, and locally as much as 9°C higher. August's heat was generally drier, with apparent temperatures often closer to the air temperature, sometimes differing by only around 2°C.
This distinction matters because two days with similar air temperatures can expose people to very different levels of thermal stress. It is also why temperature records alone cannot capture the full impact of an extreme summer.
What allowed these heatwaves to develop and persist? Part of the answer lies in the atmospheric circulation above Europe.
This atmospheric pattern has a name: atmospheric blocking. Most of the time the jet stream runs west to east, Atlantic weather arrives, and then it moves on as it is pushed eastwards by the planetary circulation. Atmospheric blocking occurs when a large-scale circulation pattern persists and disrupts the usual west-to-east movement of weather systems. It often involves a high-pressure ridge that diverts the jet stream around it.
Directly under that high-pressure ridge the air sinks, which means the sky stays clear and the heat builds on itself. If this system remains stuck over one area for too long, the soil starts to dry and the sunshine starts heating the air instead of evaporating water, creating that oven-air effect.
Meteorologists can identify these circulation patterns using the geopotential height of the 500 hPa pressure surface, known as Z500, typically around 5.5 km above sea level. Warm atmospheric columns tend to have greater thickness, which can contribute to higher geopotential heights. Winds in the middle atmosphere generally flow approximately along contours of constant geopotential height, curving around ridges and troughs.
The 24 June map uses Z500*. At each latitude, that is the 500 hPa height minus the average height along longitude, so the ridges and troughs on that day stand out from the west–east mean. Positive values are higher than that mean. It is not the height minus the usual height for the time of year.
Hot air drawn up from the south transported additional heat into the region, while subsidence helped suppress clouds. The peaks on 24 June and 11 July had a push of subtropical air, helped at times by low pressure west of Iberia. A review of Euro-Atlantic blocking and extremes goes through this properly: Kautz et al., 2022.
June had the picture-book version of an atmospheric block, an omega block. One high-pressure area in the middle and a low-pressure area on each side, like the Greek letter Ω, shown on the figure below. The most recent clean historical omega was detected during the 2015 European omega block, around 1 July 2015, and you can see it on the explorer page.
Omega block
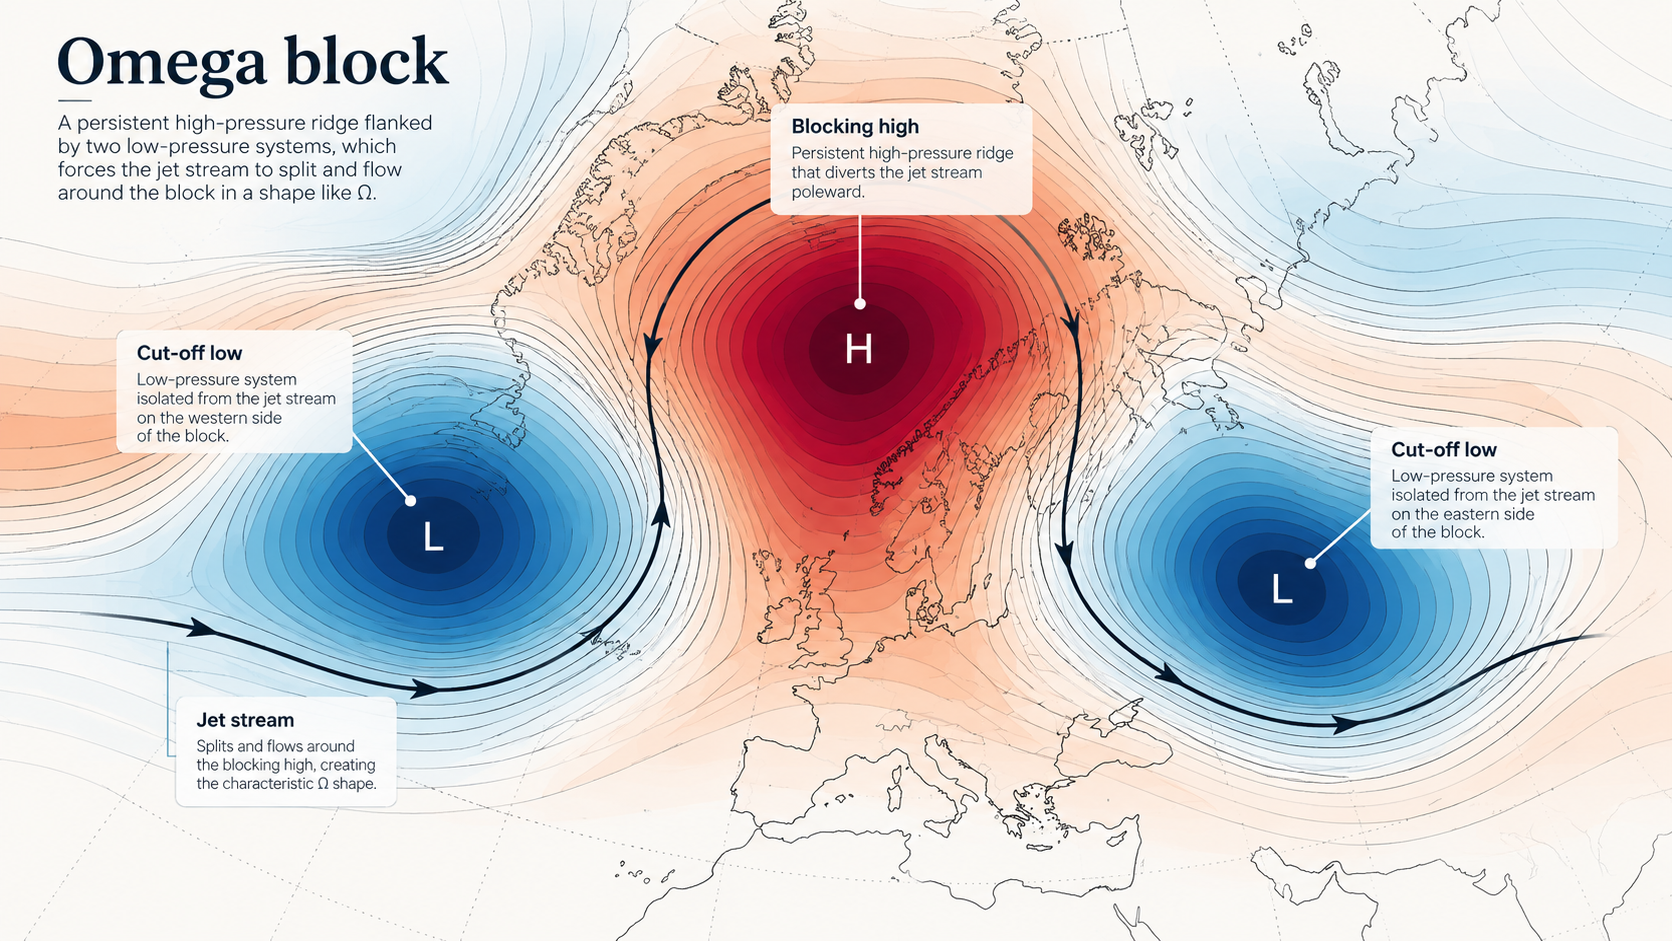
CEDIM went through that heatwave day by day and found that there was an omega phase, but it did not lock in the way a classical high-latitude block does. Their report covers 13–29 June across western, central and southern Europe. The June circulation developed an omega-like configuration, but the ridge evolved rather than remaining stationary throughout the event. The cut-off low west of Iberia also contributed to the northward transport of warm air.
The odd part of the 2026 climate is that a version of this pattern kept coming back from May into September. Copernicus describes repeated blocking highs, the disrupted jet stream, the diversion of Atlantic storms, and heat building under clear skies. Copernicus Figure 16 puts every peak from May to September on one page: 500 hPa height, the wind at that level, and temperature at about 1.5 km.
The figure below is a block shown on a real day, 24 June 2026, during the June spell. The high sits over the region that was breaking temperature records that week.
24 June 2026


ERA5T. Z500* is the 24 June 00:00 UTC geopotential height anomaly. The labels are that day's maximum 2 m temperature.
The same day is on the explorer.
The next figure is a different anomaly. It is the 500 hPa height on four days, minus the 1991–2020 height for that same calendar day. On each of these days the average over western Europe was higher than that baseline: about 120 m on 24 June, 70 m on 11 July, 90 m on 29 July and 120 m on 14 August. The surrounding pattern is not the same from one day to the next, and a positive anomaly here is not a formal blocking diagnosis.
Circulation on four days in summer 2026


ERA5/ERA5T 500 hPa height at 00:00 UTC, minus the same calendar day in 1991–2020. Positive values are higher-than-usual heights. The days can be compared with each other. They are not identical, and they are not labelled as omega blocks. Climatology: WeatherBench2 ERA5. 2026: ARCO ERA5/ERA5T.
The ocean played its part in two distinct ways.
Close to the coast, the seas hit seasonal records: the southern North Sea, the Channel, the Irish Sea, Biscay, west of Portugal, and the western Mediterranean. The unusually warm seas around Europe provided an additional source of heat and moisture to the atmosphere. In coastal regions, this can limit nighttime cooling, particularly when warm, humid air is transported inland. Persistent circulation patterns helped maintain these conditions, although the nighttime temperatures also depended on local cloud cover, wind and humidity.
In summer 2026, 56% of the European ocean domain was much warmer than average, and 22% had record-high summer sea surface temperatures. Daily averages reached 22.6°C in Biscay on 13 August and 29.4°C in the western Mediterranean on 15 August. Parts of the western Mediterranean went over 30°C in July, August and September. Parts of Biscay were in an extreme marine heatwave in July.
Clear skies and light winds heated the sea surface and stirred it less, so cooler water stayed below. Tropical nights, defined as a night when the temperature does not drop below 20°C, reached northern Germany, the Netherlands and southern Britain. Parts of northeastern Spain and Italy had 30–45 more tropical nights than average.
North Atlantic and European seas, summer 2026


June–August 2026 sea-surface temperature, minus the 1991–2020 June–August mean. The European seas are warmer than average. A cooler patch sits in the subpolar North Atlantic. This is the observed contrast. It is not evidence that the pattern caused the blocking. 6-hourly ERA5. 1991–2020: WeatherBench2. 2026: ARCO ERA5/ERA5T.
Further west, the subpolar North Atlantic was cold, and had been since at least December 2025, before summer started. One possibility being investigated is whether the temperature contrast between the cooler subpolar North Atlantic and warmer waters farther south influenced the atmospheric circulation, potentially influencing the position and waviness of the jet stream, and the development of ridges over Europe. However, the role of this pattern in the repeated European blocking episodes remains uncertain. Copernicus says the reasons the blocks kept returning are being explored, and it is still an open question.
The highs landed on a landscape that was already set up to dry out.
Much of western Europe and Italy came out of a very wet winter, through a dry spring, into serious summer soil-moisture deficits. Parts of central and eastern Europe were already dry in spring. By late summer, drought on the three-month standardised precipitation–evapotranspiration index covered a lot of western and central Europe, the Balkans and northwestern Türkiye. About 46% of European land was in drought at the end of August, and a large share of that area was extreme drought.
Rivers show how long it lasted. In the European Flood Awareness System record, which starts in 1992, summer 2026 had the most severe low-flow conditions for Europe as a whole. About 67% of the river network was below average. At their outlets, the Loire, Seine, Rhine, Glomma, Vistula and Danube all had their lowest summer-average flow in that record. These are simulated flows from EFAS, not a gauge reading at every bend.
Fires followed the fuel, not only the afternoon temperature. In some regions, wet conditions earlier in the year encouraged vegetation growth. Subsequent drying, high temperatures and low humidity increased the availability of combustible vegetation, contributing to dangerous fire-weather conditions. Spain and France both had exceptional seasons. The sequence is the point: moisture, growth, then a stuck dry pattern.
Declaring one root cause is tempting, but it tends to oversimplify a complex dynamic in a large system. Two different questions get collapsed into that one, and the answers are not equally solid.
The first is whether this kind of block is becoming more common, or lasting longer. Climate models can simulate and project atmospheric blocking, but estimates of future changes in its frequency, location and duration remain uncertain, particularly because different blocking definitions and models do not always agree.
My MSci ran into the same difficulty at the labelling and manual detection stages. After combining the three standard definitions, on 40 years of European summers, only three days were simultaneously classified as blocked by all three methods, out of 3,680 days. Separately, three physics students and three academics checked the maps by hand, and their labels agreed with each other at least 95% of the time. Although agreement between annotators does not necessarily establish that their classifications were correct, the contrast illustrates how sensitive blocking detection can be to the method used. Woollings et al., 2018 is the review I still start from, and it is cautious for a reason.
The second question is how hot a familiar setup has become. One thing that can help provide better insight into the system is the temperature profile that follows a persistent atmospheric pattern. World Weather Attribution looked at June, which has a similar southerly flow when compared to historic heatwaves. The analysis estimates that comparable circulation conditions would have produced daytime temperatures approximately 3.5°C lower in the climate of 1976 and 2°C lower in the climate of 2003. The nights would have been about 2.4°C cooler than in 1976, and about 1.3°C cooler than in 2003.
Over the region they studied, the hottest daily temperatures are warming at about three times the global rate, and nighttime temperatures at about twice that rate. In large parts of western Europe, June is warming faster than the other months.
Summer 2026 was extreme because blocking-type highs kept returning from May into September. June included an omega phase, shorter-lived than a classical high-latitude block. Sunshine, dry soils, warm seas around Europe and humid nights then compounded. The reason those highs kept returning, including a possible role for the cold blob, is still open. The intensity of the heat, given that kind of flow, is not what the same kind of flow produced twenty or fifty years ago.
The atmosphere arranged itself in a way we have seen before. Yet, Western Europe had never had a summer this hot.
Explore blocking maps · Science and glossary